How to Debug Apps with Windows Subsystem for Android (WSA): A Beginner’s Guide
Learn how to debug Android apps on Windows Subsystem for Android (WSA) using ADB, logcat, and Android Studio with this beginner-friendly guide!
Learn Windows Subsystem for Linux: A Practical Guide for Developers and IT Professionals 1st ed. Edition, Kindle Edition
Introduction:
The Windows Subsystem for Android (WSA), which was introduced with Windows 11, opened up intriguing possibilities for users and developers alike. Though occasionally these apps might not work as intended, WSA allows you to run Android apps directly on Windows 11. To find and fix these problems and make sure everything functions properly, debugging is crucial. Don't worry if you're not experienced with debugging! This tutorial will present the method to you in an easy-to-understand manner.
Why Debugging Matters in WSA
To find and fix faults in your apps, debugging is essential. Debugging is crucial when your Android software crashes, freezes, or exhibits other strange behaviors on Windows 11. It allows you to:
-
Identify the root cause of the problem: Identify the precise location of the error in your code.
-
Fix issues and improve performance: Make sure your programs run well on Windows 11.
-
Verify compatibility: Make sure your application runs correctly inside the WSA framework.
Beginning the Debugging Process
Before using WSA to debug your Android apps, make sure you have the following prerequisites:
-
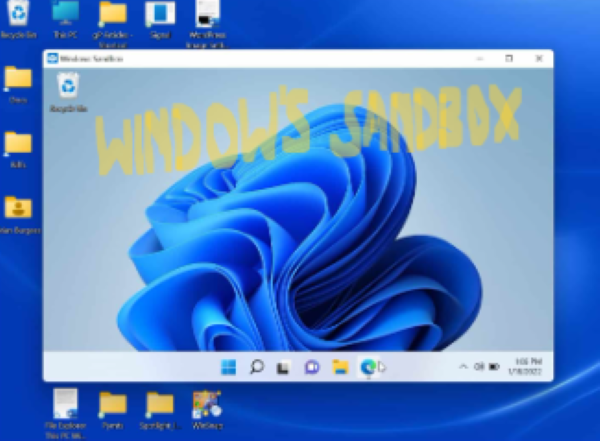
WSA is pre-installed in Windows 11 - it can be manually installed or purchased from the Microsoft Store.
-
Android Debug Bridge (ADB) - WSA and other Android devices may communicate with each other thanks to the Android Debug Bridge (ADB).
-
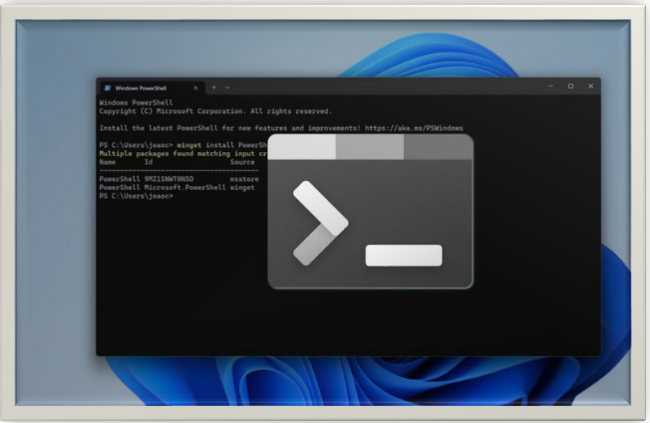
A command-line interface (CLI): Make use of PowerShell or the Windows Command Prompt (CMD).
-
Android app (APK file or sideloaded app) - The software you want to debug
Step-by-Step Guide to Debugging Apps in WSA
Step 1: Turn on WSA's Developer Mode.
-
Start by opening the Windows Subsystem for Android Settings app
-
Locate the Developer mode option by scrolling down.
-
Toggle Developer mode on.
-
Because you will need it for the ADB connection, make a note of the IP address that is displayed (for instance, 127.0.0.1:58526).
Step 2: Set up and install ADB
-
Download the ADB tool from the official Android developer website. ADB is a command-line tool that makes it easier to communicate with your Android device—in this case, your WSA instance.
-
Open a specified folder (such as C:\adb) and unzip the downloaded file.
-
Open PowerShell or Command Prompt, then type the following to open the folder:
cd C:\adb
-
To run ADB commands from any command prompt window, update the platform-tools folder in your system's PATH environment variable.
-
Enter the following command at the command prompt and hit Enter to connect to WSA using the previously specified IP address:
adb connect 127.0.0.1:58526
If it works, a notification stating "connected to WSA" will appear.
Step 3: Check the Connection
Run the following to see if WSA is connected:
adb devices
A device listing should appear, verifying the connection.
Step 4: Debug Your App
You can launch and debug your application if it's already installed on WSA:
Using Logcat to View Logs:
-
A vital tool for displaying system and application logs is Logcat.
-
Type the following command in the Command Prompt or PowerShell window and press Enter.
adb logcat
-
A constant flow of log messages will show up to help you find mistakes and comprehend how your program behaves.
-
To concentrate only on the logs from your application, you can optionally filter these logs.
Install an APK manually.
-
Take these actions to manually install an APK:
-
Type the following command:
adb install your-app.apk
- Check the log output for errors and use those messages to find solutions if the application crashes.
Use Android Studio (Selective)
Android Studio can be a useful tool for developers to debug WSA apps:
-
Open Android Studio, then select Device Manager.
-
Select the WSA instance after choosing Physical Device.
-
Use breakpoints, logs, and performance tools to find any problems when you run your application in debug mode.
Analyzing App Data:
-
You might occasionally need to look at the data that your app is storing.
-
You can use the Device File Explorer in Android Studio or use adb to pull files from the WSA instance.
Typical Debugging Issues & Fixes
-
If ADB is unable to connect to WSA - restart WSA, make sure Developer Mode is turned on, then try connecting once more.
-
When the application crashes on launch - Check the adb logcat logs for any error messages.
-
If the application does not install - make sure the APK file is not corrupted and that ADB has the required permissions.
-
Performance Issues: Use the profiling tools in Android Studio to examine how well your app performs.
Tips for Effective Debugging
-
Include descriptive log messages: Include log messages in your code to track the flow of execution and identify possible problems.
-
Test on different configurations and devices: Make sure your app works correctly in the WSA environment across various screen sizes and Android versions.
-
Consult the official records: Google and Microsoft both provide a wealth of information about Android and WSA development.
Conclusion
Although utilizing the Windows Subsystem for Android to debug apps may seem difficult at first, these instructions make it simple to connect, install, and fix problems with ADB. These procedures make your workflow more efficient, regardless of whether you're a developer or just testing.